
More than 9 out of 10 UK properties are inaccurately insured

New data shows a five-year fall in underinsurance, but accurate buildings sums insured remain rare.
Based on data from 46,917 rebuild cost assessments carried out across the UK, the latest RebuildCostASSESSMENT.com Property Insurance Infographic shows a clear imbalance.
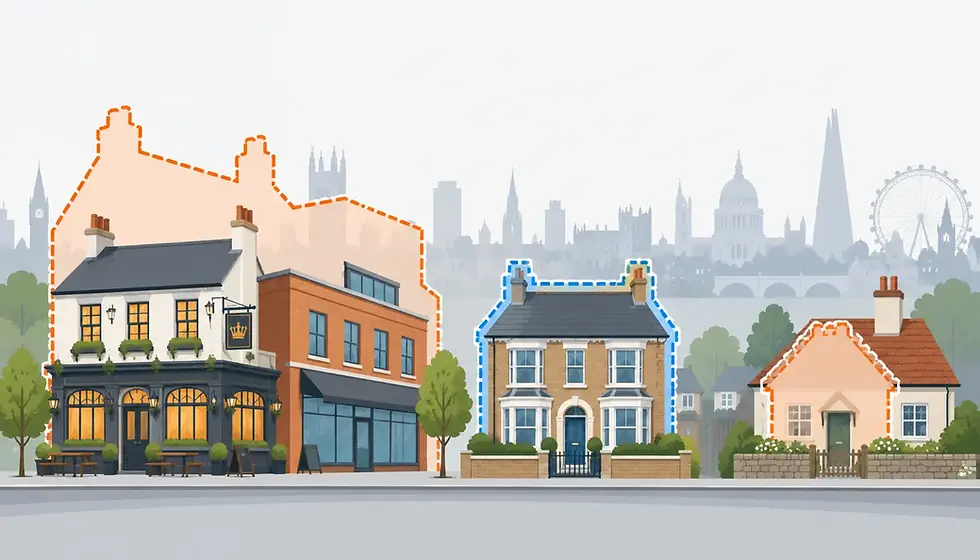
67% of properties were underinsured and 25% were overinsured. Just 8% had a buildings sum insured matching their assessed rebuild cost.
Underinsurance remains the main concern for UK properties because a low sum insured can leave policyholders facing a shortfall.
Five years ago, 83% of properties were underinsured. That figure has fallen each year, reaching 67% in 2026. This is progress, but it has not led to widespread accuracy.
Five years of change, but accuracy is still low
The direction of travel is clear. Underinsurance fell from 83% in 2022 to 81% in 2023, 76% in 2024, 70% in 2025 and 67% in 2026.
Overinsurance moved the other way. It rose from 13% in 2022 to 25% in 2026.
Johnny Thomson, Head of Strategic Planning at RebuildCostASSESSMENT.com, said: “Underinsurance is falling, which is encouraging. But nine in ten properties are still insured for the wrong amount. That shows why the focus must be on the accuracy of the sum insured, not simply whether the figure has gone up or down.”
Why underinsurance still matters for UK properties
If a building is insured for too little, a claim may not cover the full cost of putting things right. If the policy includes an Average Clause, the insurer may also reduce the amount paid for a claim. The outcome will always depend on the policy and the circumstances of the claim.
Underinsurance is not always obvious at renewal. A figure may have been copied from an old policy, based on the market value rather than the rebuild cost, or increased each year without a proper review.
Indexation can help keep a sum insured up to date. It does not check whether the starting figure was right in the first place, or whether the building has changed.
The gap is still growing
The financial gap behind the figures is also getting wider. Across the assessed properties, the difference between declared buildings sums insured and assessed rebuild costs came to around £20.12 billion, approximately £2.36 billion higher than in comparable 2025 data.
Johnny Thomson added: “Taken together, these results show what can happen when a sum insured is treated as a number to roll forward, rather than something to review. It may look familiar on a renewal schedule, but a lot can change between assessments. That is why both underinsurance and overinsurance need attention: the aim is to base the figure on the building as it is today.”
Underinsurance accounted for £15.61 billion of the total, compared with £4.51 billion linked to overinsurance.
Some buildings stand out
Public houses, licensed premises and hotels had the highest underinsurance rate in the 2026 data, at 85%. This combined category showed no improvement on 2025. Health centres and surgeries followed at 79%, while offices and nursing homes/care homes were both at 78%.
Listed properties showed little improvement. In the latest data, 79% were underinsured.
These are buildings where the rebuild cost can be harder to judge from an old policy figure. Altered layouts, specialist services, heritage features and difficult access can all add to the cost of rebuilding.
Flats and apartments showed a different problem. More than a third, 37%, were overinsured.
Value does not make it easier
In the lower declared value bands, underinsurance was most common. Among properties declared below £250,000, 89% were underinsured.
At the other end of the scale, 60% of properties declared between £10 million and £20 million were overinsured.
At lower values, a rebuild cost can be confused with a market value. At higher values, a sum insured can keep rising through indexation without being reviewed. In both cases, the figure on the policy can drift away from what it should be.
Getting back to the right figure
A rebuild cost is not the same as market value. It is the amount needed to rebuild the property if the worst happens.
That figure is worth reviewing when the building has changed, when an earlier assessment is getting old or when the sum insured is based on an estimate rather than a current rebuild cost assessment.
The 2026 Property Insurance Infographic shows where underinsurance and overinsurance were most common by building type, business sector and sum insured band. Download it below to explore the findings in full.
Johnny added: “The aim is not simply to increase or reduce the number on the policy. A current rebuild cost assessment gives everyone involved a clearer basis for deciding whether it reflects the cost of rebuilding the property.”


